The New Museum in New York City opened Heart Bot, a robot that produces drawings based on the collective pulse rates of the people in the room.
“Hedonometer” 2011 Peter Dodds, Chris Danforth

It’s what most people say they want. So how do we know how happy people are? You can’t improve or understand what you can’t measure. In a blow to happiness, we’re very good at measuring economic indices and this means we tend to focus on them. With hedonometer.org we’ve created an instrument that measures the happiness of large populations in real time.
Our hedonometer is based on people’s online expressions, capitalizing on data-rich social media, and we’re measuring how people present themselves to the outside world. For our first version of hedonometer.org, we’re using Twitter as a source but in principle we can expand to any data source in any language (more below). We’ll also be adding an API soon.
“Transcendence” 2014 John Slepian
John Slepian is using his brainwaves in this performance by way of an EEG sensor. The structure he sits on is linked to the EEG sensor and reacts to his emotional state. When he reaches an emotional state of meditation the seat rises.
“A Really Great Idea” 2014 John Slepian
“A Really Great Idea” is a humorous conceptual performance/installation/video work, inspired by early Conceptual Art, that literally makes the thinking of the artist visible. In form, it refers to much of the highly influential performance and video work of the mid-1960s-1970s in which simple actions undertaken by the artists were structured in order to make a piece (Bruce Nauman, Marina Abromović and Ulay, Tehching Hsieh) and/or the idea alone was the piece (Lawrence Weiner, Yoko Ono). How would, or could, work like this function in our age of instant technological gratification? “A Really Great Idea” is an absurdist proposal for a contemporary technological “art of ideas.”
“Mood.Cloud” 2014 Younghui Kim
This interactive installation is a visual representation of collective emotional moods that are translated from PAM (The Photographic Affect Meter, JP Pollak, Phil Adams, and Geri Gay) input. The PAM is a one-click measure of emotional state now widely used in place of or in addition to traditional pen and paper psychological assessments.
This piece is an on-going collaborative research to see how these voluntary PAM inputs of building users would be relate to the visual representation of collected mood at a given timeframe. This mood.cloud platform can be re-programed in diverse visual patterns.
“Mood Map” 2014 Noa Younse
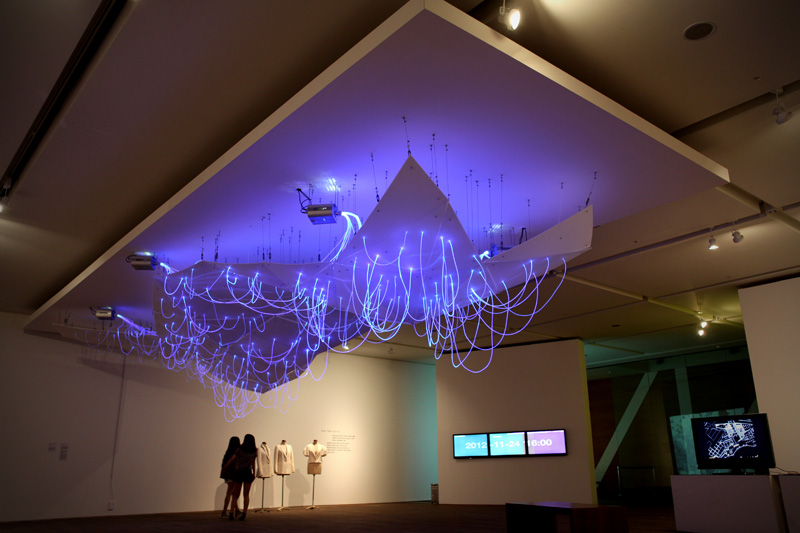


This project exhibited in the Museum of Art at Seoul National University visualizes the mood of Koreans through the use of Twitter data. They created custom software that could analyze Korean Twitter data through the Twitter API. There are six different moods that are visualized in light and color: joy/pride, love, fear/shame, anger, pity, and sadness/frustration, each associated with a different color. There are 3 different display cycles. One displays the mood of tweets in real time, the second shows the collective data of two moods over the past hour, and the third is the collective data from one mood from that day. The piece is dynamic updating and changing every 30 seconds.
“QI-Visualizer” 2014 Yuan-Yi Fan
“Qi Visualizer” is an interactive installation that translates ineffable dialogues of the heart with the body into a collective poetry via audience participation. Audience can participate by uploading their pulse spectrograms using mobile biometrics.
“Eunoia II” 2014 Lisa Park
Placing herself in the middle of the 48 pools, Park wears an EEG sensor that detects her brainwaves during the performance. She explains, “it measures frequencies of my brain activity relating to my state of consciousness while wearing it. The data collected from EEG is translated in real time to modulate vibrations of sound using software programs.” She uses computer programs including Processing, Max/MSP, and Reaktor to generate sound from the EEG data.
“Eunoia” 2013 Lisa Park
“Eunoia” is a performance that uses Park’s brainwaves — collected via EEG sensor– to manipulate the motions of water. It derives from the Greek word “ey” (well) + “nous” (mind) meaning “beautiful thinking”. EEG is a brainwave detecting sensor. It measures frequencies of Park’s brain activity (Alpha, Beta, Delta, Gamma, Theta) relating to my state of consciousness while wearing it. The data collected from EEG is translated in realtime to modulate vibrations of sound with using software programs. EEG sends the information of Park’s brain activity to Processing, which is linked with Max/MSP to receive data and generate sound from Reaktor.
“Parametric Expression” 2013 Mike Pelletier
The digital animation ‘parametric expression’ features anamorphic figures displaying abstract adaptations of human emotion. Amsterdam based interactive artist Mike Pelletier has explored quantified emotion – the technology that monitors the relative state of human beings, most closely associated with facial recognition software. the modeling and contouring of the renderings are accurately comparable to human ones but the digital manipulations they undergo make the eerie figures jarring reflections of humanity. the computer generated bodies are twisted and expanded, bearing devilish grins, glaring eerily at one another, and angrily approaching the viewer.
